With Halloween just around the corner, it seems appropriate to discuss a somewhat spooky superstition based on the market performance of this time of year. The Halloween effect (also known as the Halloween strategy, or Halloween indicator) is an apparent market timing strategy that is centred on the belief that the market performs better from Halloween to early May than it does between May and Halloween. In this blog, we will look at if this is just another headline-grabbing story or whether, historically speaking, there is any truth to market performance in this period, and whether this applies to crypto.
Whether it’s the blessings of the Celtic gods, a spike in candy sales, or just good old-fashioned witchcraft, some suggest that markets do in fact perform better during this time, but this is largely imaginative.
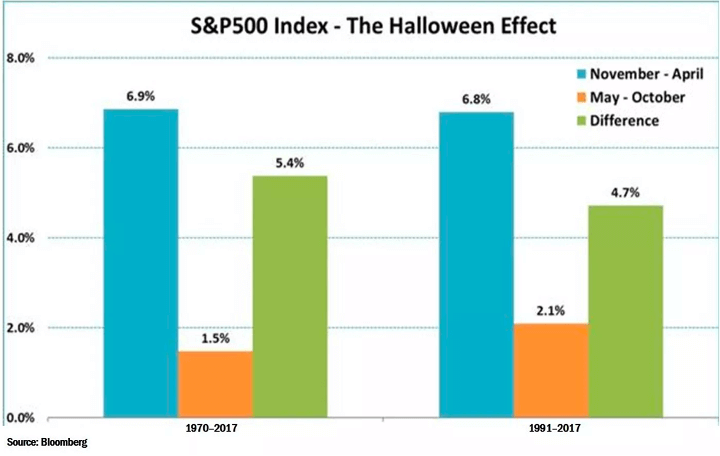
According to the American Economic Review, major stock exchanges did produce larger returns during the November to April period. Still, could this be just a way of cutting data for the sake of proving an apparent theory?
Of course, while this is an interesting guess at market performance, it must be approached with a large amount of scepticism, as a number of factors contribute to the market and solely picking random dates should not be the basis of an investment strategy.
- > Does the Halloween effect apply to crypto?
- > Past performance of the Halloween effect on Bitcoin
- > What is rumoured to cause the Halloween effect?
- > Other apparent trading myths
- > Trick or treat?
Does the Halloween effect apply to crypto?
The Halloween effect has generally been applied to traditional markets. Given the infancy and volatility of the crypto, the Bitcoin price history cannot accurately be compared with this freaky theory. The below table from Bloomberg shows the performance of the S&P500 Index, a subset of 500 US shares, between 1970-2017 and the data of the apparent Halloween effect.
Past performance of the Halloween effect on Bitcoin
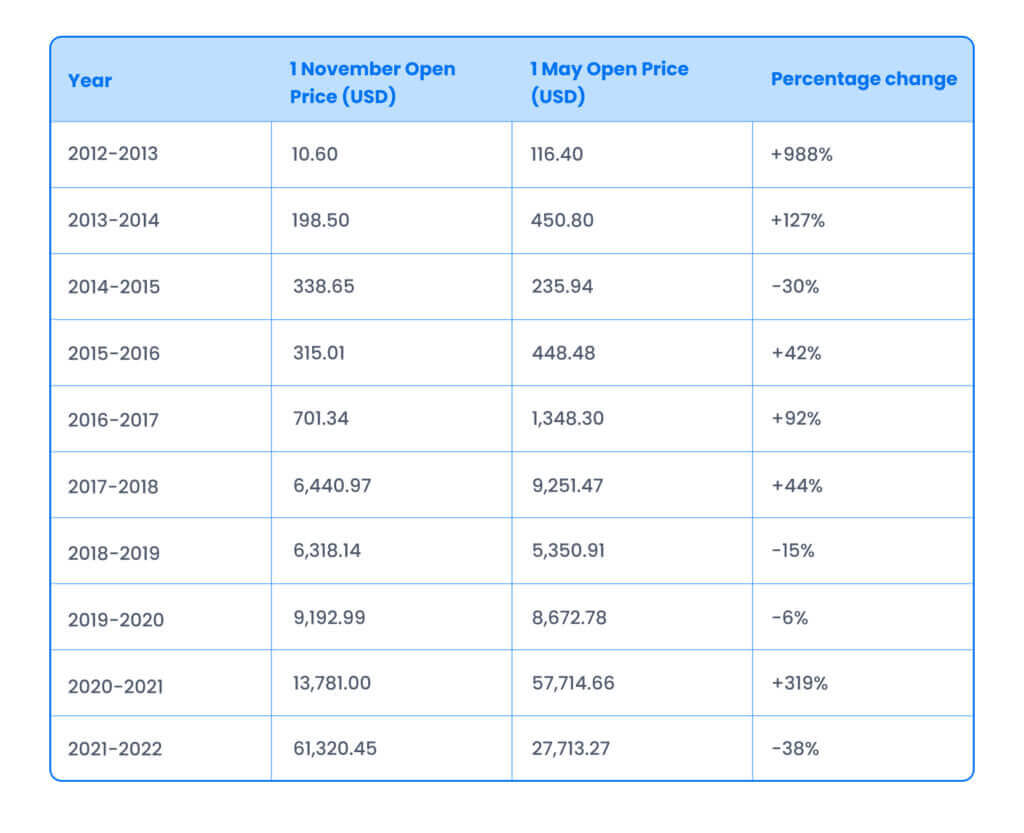
If you bought Bitcoin on the 1st of November and sold on the 1st of May for the past 7 years, you would have made a profit in 4 of these periods. Years 2018-2019, 2019-2020, and 2021-2022 would have each resulted in a loss, in some cases a substantial one. The table below shows the data available since 1 November 2012 of the supposed ‘Halloween effect’. Given the cryptocurrency industry is still in its teenage years (although you might not catch it trick-or-treating!) and the various bull and bear markets experienced during this period, this data must be approached with a level of scepticism.
Past performance is not ever an indicator of future performance, and there are more factors than arbitrary dates that effect the Bitcoin and crypto markets. The Halloween effect also relies on a degree of stability, which rarely occurs within the crypto industry. A host of factors play upon the markets, and the benefits of any one strategy or effect can be outweighed by the drawbacks of another.
What is rumoured to cause the Halloween effect?
It is uncertain as to what precisely could cause the Halloween effect. One theory suggests that the effect could be caused by seasoned investors going on vacation during the northern hemisphere’s summer and therefore aren’t actively trading. This theory is also referred to as ‘sell in May and go away’, this could see investors removing capital from assets they otherwise couldn’t cash out of while on holiday. This could have had some merit in the past, when executing trades meant having to be in close proximity to a designated trading centre.
However, given trades can now be performed anywhere in the world, this theory is unlikely to be true.
There are several other theories and opinions to attempt to explain the Halloween effect, yet none have been proven. We may never know what’s behind this strange superstition, but traders love to predict the future market performance based on set theories. Whether this effect plays out will be shown in time, but it can’t be viewed in a vacuum, nor can it be a basis to warrant trading.
Other apparent trading myths
The Santa Claus rally
Another random superstition is often referred to as the ‘Santa Claus rally’. This is a belief that stock prices rise over the last five trading days in December and the first two trading days the following January. This apparent rally was first theorised in 1972.
Round numbers
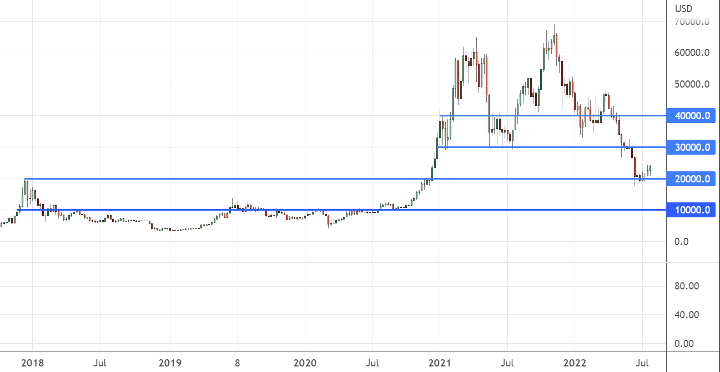
Intrinsic to one of the many deficits in human reason is the bias we grant to round numbers. Many people think in round numbers such as $500 or $1000 per coin. This likely carries over into the crypto market, meaning asset prices can occasionally struggle to move beyond round numbers, causing markets to often revolve around them. These round numbers can often act as support and resistance levels.
Understanding this trend and remaining aware of the way this bias affects people’s own thinking, can be valuable when making investment decisions. The Bitcoin chart below shows how Bitcoin interacts with round number prices such as $10,000, $20,000, $30,000 and $40,000 USD. This, however, cannot be isolated and should be viewed without the broader market in mind.
Trick or treat?
Investors who use the Halloween effect aim to fill their candy bags over the effect’s arbitrary window. But, whether this occurs or not depends on more factors than a few random dates. Whether this superstition causes a trick-or-treat depends as much on mythology as the success of the latest film in the Halloween franchise. Do you think the Halloween effect is more kooky than spooky?
Ted