Buy PEPE in minutes
More about this metric
Holders Making Money at Current Price
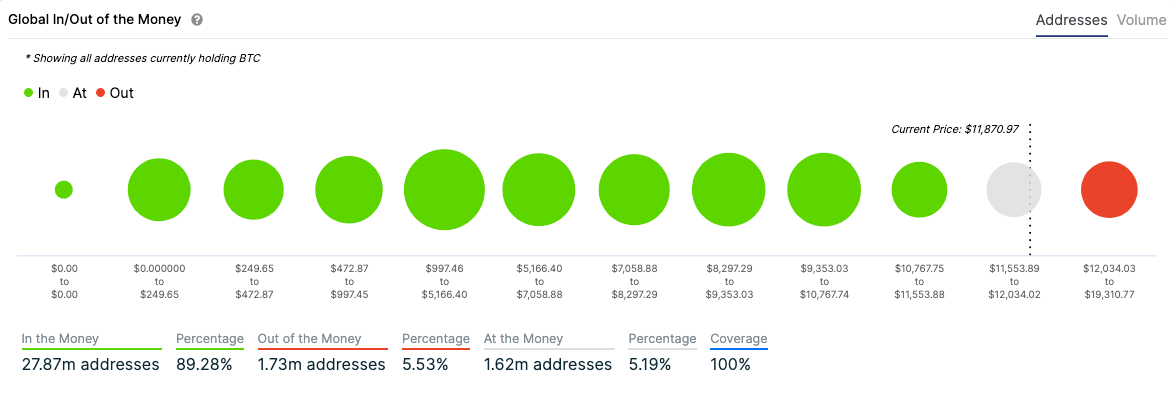
This section provides an overview of the Global In/Out of the Money indicator, which reveals the percentage of addresses holding the crypto-asset that are currently experiencing profits (in the money), breaking even (at the money), or facing losses (out of the money) based on the current market price.
Concentration by Large Holders
In this section, we examine the combined percentage of the circulating supply held by two groups: whales (addresses holding over 1% of the supply) and investors (addresses holding between 0.1% and 1% of the supply). The sum of these percentages represents the total concentration by large holders.
Holders' Composition by Time Held
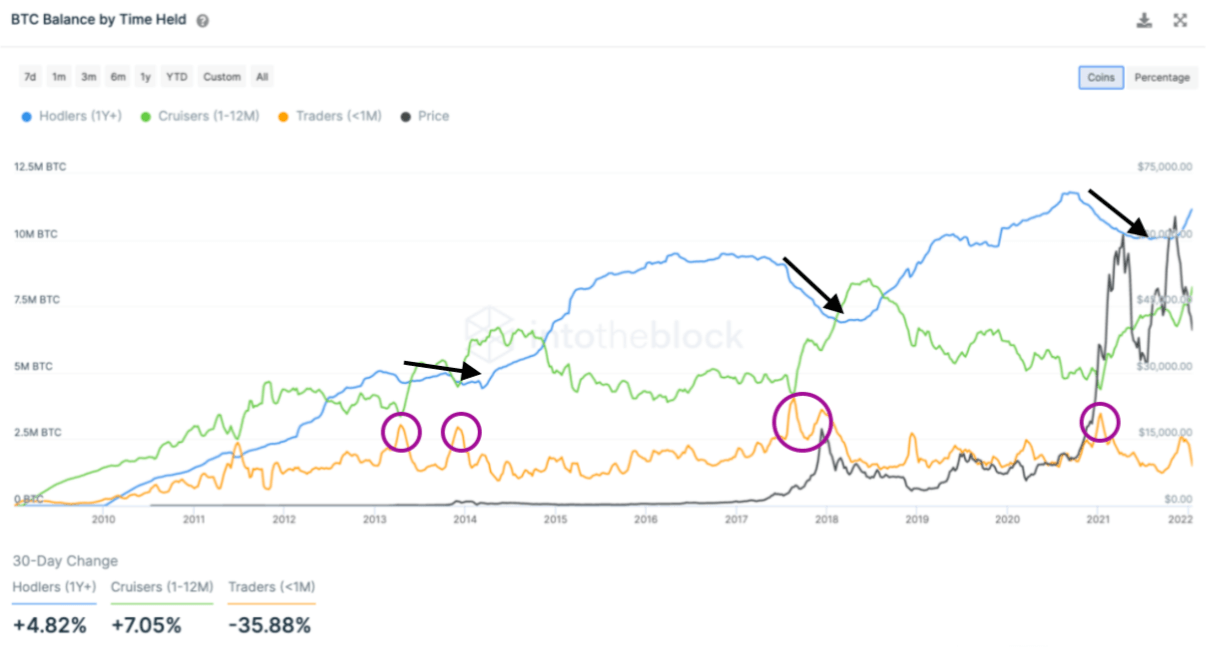
Here, IntotheBlock analyse the distribution of ownership for the crypto-asset based on the duration of time that addresses have held the asset. All addresses are categorised as either Hodlers (holding the crypto for over a year), Cruisers (holding for more than a month but less than a year), or Traders (holding for less than a month). This metric assumes the categories.
Transactions Greater than $100k
This section presents data on the total volume of transactions exceeding $100,000 USD individually, as well as the number of transactions surpassing this threshold over the past 7 days.
Total Exchanges Inflows
This metric aggregates the total volume of a crypto-asset being deposited into top centralized exchanges over the past 7 days, based on IntoTheBlock's Inflow Volume.
Total Exchanges Outflows
This indicator displays the total amount of a crypto-asset being withdrawn from top centralized exchanges over the past 7 days, based on IntoTheBlock's Outflow Volume.
Financial & Network Indicators
More about this metric
The Daily Active Addresses indicator is a measure of the number of new addresses, total active addresses, and zero balance addresses on a daily basis. Here's how these categories are defined:
New Addresses
These are newly created addresses that receive their first deposit in a specific crypto-asset.
Active Addresses (DAAs)
Active Addresses refer to addresses that have made one or more on-chain transactions on a given day.
Zero Balance Addresses
Zero Balance Addresses are addresses that have transferred out or potentially sold all of their holdings in a particular crypto-asset.
Why is this helpful?

Tracking Daily Active Addresses (DAAs) can be a useful metric for monitoring network activity over time. Generally, an increase in DAAs indicates higher blockchain usage, while a decrease suggests lower demand for the network. DAAs often show a correlation with price activity, making them a leading indicator for price movements, as depicted in the graph above.
Quick Tip: Growth in daily active addresses tends to be associated with an increase in price, as demand for network usage is directly related to the demand for the blockchain's native token.
It's also worth monitoring the relationship between DAAs and price movements. If there is a strong correlation, it indicates that active addresses are following price rather than using the crypto-asset independently.

New addresses serve as a proxy for new money flowing into a crypto-asset. In some cases, this can be interpreted as a sign of optimism or even FOMO (fear of missing out). On the other hand, zero balance addresses indicate money leaving a crypto-asset, suggesting holders' loss of interest or lack of belief in the asset, or acting out of fear.
As shown in the screenshot above, new and zero balance addresses often move together. However, divergences between the two can indicate relative optimism or pessimism. For example, a rise in new addresses in late December 2019 could be seen as new investors buying or using a crypto-asset, which could be a bullish signal. Conversely, a higher number of zero balance addresses during the March 2020 price crash highlights pessimism or fearful behaviour among holders.
More about this metric
Overview
The GIOM classification system categorises addresses based on their profitability status: in the money, at the money, or out of the money. This calculates average cost of an address's tokens based on the weighted average price at which they were acquired or received. By analysing addresses and tokens, an overall view of profitability for a specific crypto asset is obtained.
Why is this helpful?

By examining the number of addresses making or losing money on their positions, users can gain insights into buying or selling pressure at particular price ranges. When a significant number of addresses are out of the money, there may be high selling pressure as these addresses may sell once the market price reaches their average cost, aiming to break even on their positions. This selling pressure acts as a resistance level, potentially hindering further price increases.
Conversely, large in the money clusters highlight important on-chain price ranges where a substantial number of addresses or token volumes were previously acquired and would currently yield profits if sold at the current price (which is higher than their acquisition cost). In such cases, a higher number of addresses in the money indicates a positive scenario for the network, as there may be less selling pressure from holders seeking to break even on their positions.
Ownership Indicators
More about this metric
Overview
IntoTheBlock classifies addresses based on their holdings into three categories:
- Whales: Addresses holding over 1% of a crypto-asset's circulating supply.
- Investors: Addresses holding between 0.1% and 1% of the circulating supply.
- Retail: Addresses with less than 0.1% of the circulating supply.
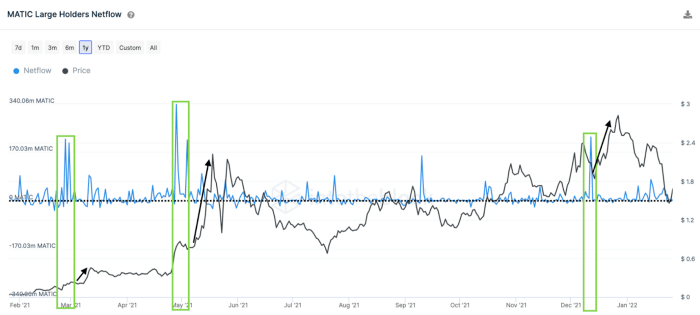
- In most cases, any holder with over 0.1% of the circulating supply of a large-cap crypto-asset holds a substantial amount of funds. Therefore, Large Holders Netflow measures the net amount of inflows minus outflows specifically related to these addresses.
Why is this helpful?

Large Holders Netflow provides insight into the changing positions of whales and investors holding over 0.1% of the supply. In essence, spikes in netflow can indicate accumulation by large players, while drops suggest reduced positions or selling activity.
In the example depicted above, we illustrate how the growth in large holders netflow (green boxes) precedes spikes in the price of MATIC. This is due to the high inflows reflecting strong buying activity, which can indicate positive momentum in the market.
More about this metric
Overview
In the same way that IntoThBlock classifies the number of addresses by their holding period, this indicator takes it a step further by adding the value that each specific group has represented over time. The indicator shows the value of coins relative to each individual group (Hodlers, Cruisers and Traders) since its historic inception. This helps to keep track of the trading behaviors of each different group.
Why is this helpful?

Hodlers tend to decrease their holdings late into bull cycles (black arrows) while Traders rush in to buy (purple circles). This occurred through the double bubble in 2013, as well as in late 2017 and in 2021. Then, a few months after Hodlers begin to increase their balance again, we tend to see the beginning of a new bull cycle.
As the saying goes, “history doesn't repeat itself, but it often rhymes”. Here we can see how that has been the case for Bitcoin and how taking a look at these long-term shifts in ownership can be helpful when attempting to time the market.
Disclaimer: The above indicators and data are licensed by Swyftx from IntoTheBlock. Swyftx does not independently verify the accuracy of the information presented, and it may contain errors. These indicators are just some of those available and should not be used as a basis to make investment decisions.
The information is for general information purposes only and should not be taken as investment advice, personal recommendation, or an offer of, or solicitation to, buy or sell any assets. It has been prepared without regard to any particular investment objectives or financial situation and does not purport to cover any legal or regulatory requirements. Customers are encouraged to do their own independent research and seek professional advice. Swyftx makes no representation and assumes no liability as to the accuracy or completeness of the content. Any references to past performance are not, and should not be taken as a reliable indicator of future results. Make sure you understand the risks involved in trading before committing any capital. Never risk more than you are prepared to lose. Consider our Terms of Use and Risk Disclosure Statement for more.
Social Indicators
More about this metric
Overview
The Twitter Sentiment indicator utilises IntoTheBlock's proprietary classification machine learning algorithm to analyse the sentiment expressed in messages related to a specific crypto-asset and its ticker on Twitter. This indicator plots the sentiment over time, allowing for the tracking of market sentiment and the level of activity associated with the crypto-asset on the platform.
Why is this helpful?
The Twitter Sentiment indicator serves as a valuable tool for assessing the emotions of market participants. At times, sentiment can act as a leading indicator, as demonstrated by Ethereum in June and July. However, in most cases, sentiment tends to be a reactive indicator. In other words, there is usually more positivity when prices rise and negative sentiment when prices fall.
Overall, Twitter Sentiment can provide an estimation of the market's current perspective on a particular crypto-asset. However, it's important to exercise caution when using it for trading decisions due to its reactive nature.
More about this metric
Overview
In the world of cryptocurrencies, where open-source and permissionless systems are prevalent, the code of most crypto-assets is publicly available on platforms like GitHub. IntoTheBlock directly links to the official GitHub repositories of various crypto-assets and extracts essential information related to developer activity within each protocol's ecosystem. Here's a breakdown of the attributes presented in the GitHub indicator:
Commits
A commit represents a set of changes made to a crypto-asset's source code by one or more developers. Commits serve as an indication of activity, progress, and ongoing maintenance within the software associated with a crypto-asset.
Stars
The act of "starring" a project on GitHub allows developers to express their interest in the developments of a particular project. Stars contribute to the ranking and recognition given by developer communities to open-source projects. Therefore, the number of stars serves as an indicator of a project's popularity and reputation by developers.
Open Issues
Open issues track various tasks, enhancements, and bugs related to crypto-asset projects. These issues reflect an active developer community that reports problems and suggests new features or improvements for a crypto-asset's code.