Crypto market cycles can give investors the bigger picture on the price fluctuations of a crypto asset. This guide will explain what a market cycle pattern is and how to attempt to identify the various stages.
What is a market cycle?
A market cycle is a blueprint of all the ‘stages’ between the peak and low of a market. It attempts to map the psychological factors that influence price trends over a long period of time. Cycles occur in all financial markets and tend to repeat over time.
Interpreting crypto and Bitcoin market cycles
Identifying and capitalising on market cycles is an important skill that every trader and investor should have. Market cycles offer a macro perspective on price fluctuations, which provides a useful contrast to the daily volatility seen in the crypto market. If used correctly, it can provide you with some interesting insights into what might be happening in a market at large, based on investor sentiment.
The Wyckoff method separates cycles into four phases:
- Accumulation phase
- Mark-up phase
- Distribution phase
- Mark-down phase.
The Wyckoff method is a very useful method, especially for quick reference, however, there is a lot more nuance in using the more traditional model made famous by the Wall St Cheat Sheet, which contains 13 different stages (as seen below).
Attempting to match the price activity of a cheat sheet with a real chart, such as Bitcoin, is a common mistake. The chart appears to have followed some logical concepts, but its purpose is to aid with sentiment analysis. It’s not a guide for future price changes.
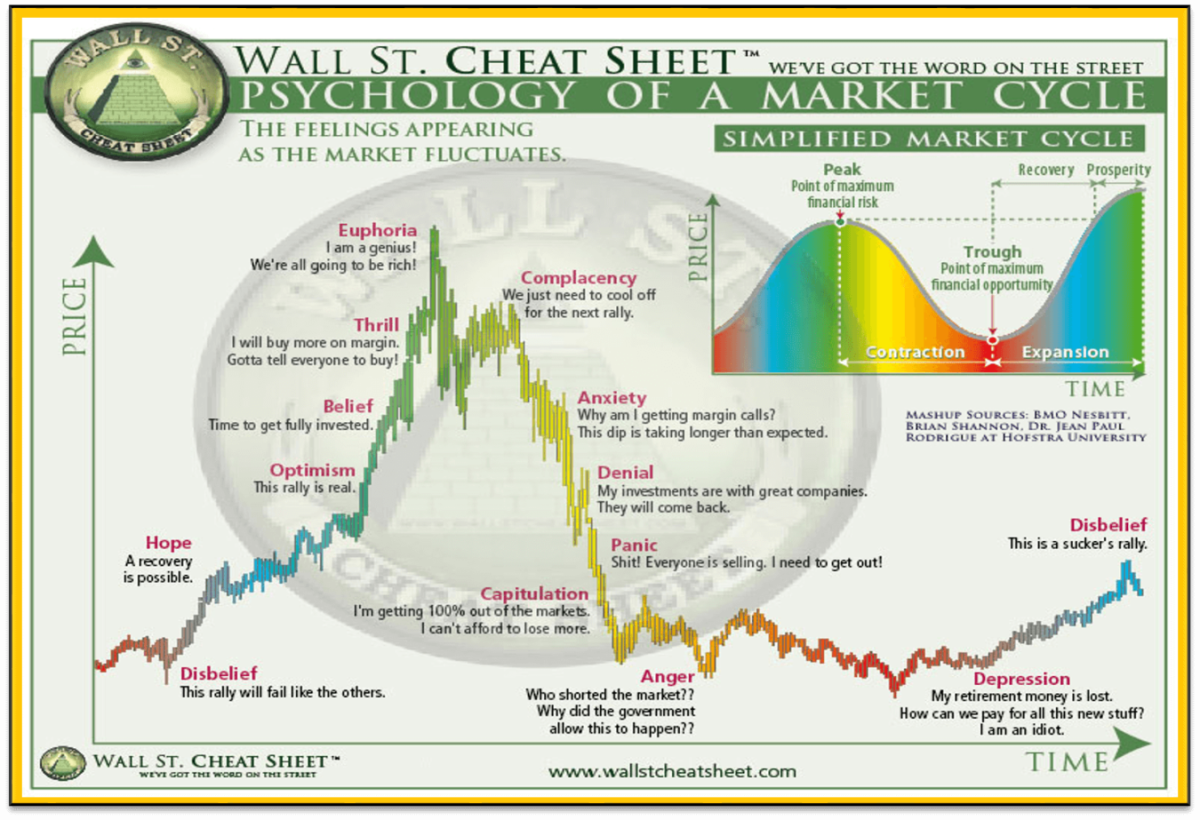
Figure 1 – The stages of a market cycle. Source Wall Street Cheat Sheet
The stages of a typical market cycle
The most widely used market cycle model includes 13 different stages that detail the key points between the low of the cycle to the peak and back down again. Each stage is characterised by a catchphrase that summarises the psychology of traders at that point in the current market cycle.
It’s worth noting that accurately identifying each cycle as it’s happening can be very difficult – otherwise, everyone would know exactly when to sell or buy into the market. For example, there is not always a clear phase, and in reality, market movements are more of a fluid evolvement over time. This type of chart can only really be applied and validated looking back historically.
Nonetheless, it can be a helpful guideline to understand as part of a broader investment strategy.
Important to Remember
Each market (or coin) often has its own cycle, as they launch at different times or experience different factors that impact price. This means an exciting new project could be in the “Belief” stage, even while the broader market is in “Depression”.
Depending on your investing goals, it may be relevant to try to guess where your coin is within its unique market cycle. The market cycle often overrides other indicators or patterns. For instance, if you notice that there is a bullish pennant on your chart, but you estimate that your coin is potentially in the “Euphoria” stage of the cycle, you may avoid that trade and could sell your assets, depending on your investment horizon.
Bitcoin and Crypto Market Cycles
The Bitcoin halving has historically been one of the crypto market cycle’s most significant events. A Bitcoin halving occurs roughly every four years. The code built into Bitcoin’s blockchain determines that for every 210,000 blocks, the reward distributed to miners is cut in half.
Historically, a huge Bitcoin price surge has occurred after each Bitcoin halving event, followed by a large pull back until the market establishes an equilibrium and prepares for the next Bitcoin halving (see Figure 3).
These events have historically had a profound impact on the crypto market largely due to their effect on Bitcoin’s, as the original crypto coin, supply and demand. As less and less BTC is released in the ecosystem, it means that new investors are snapping up Bitcoin that’s already in circulation. This is especially true during crypto bear markets when most BTC owners lock-up their coins and throw away the key. The dwindling supply, combined with growing demand, can create a perfect storm of upward price pressure on Bitcoin and has previously kickstarted a widespread bull market.
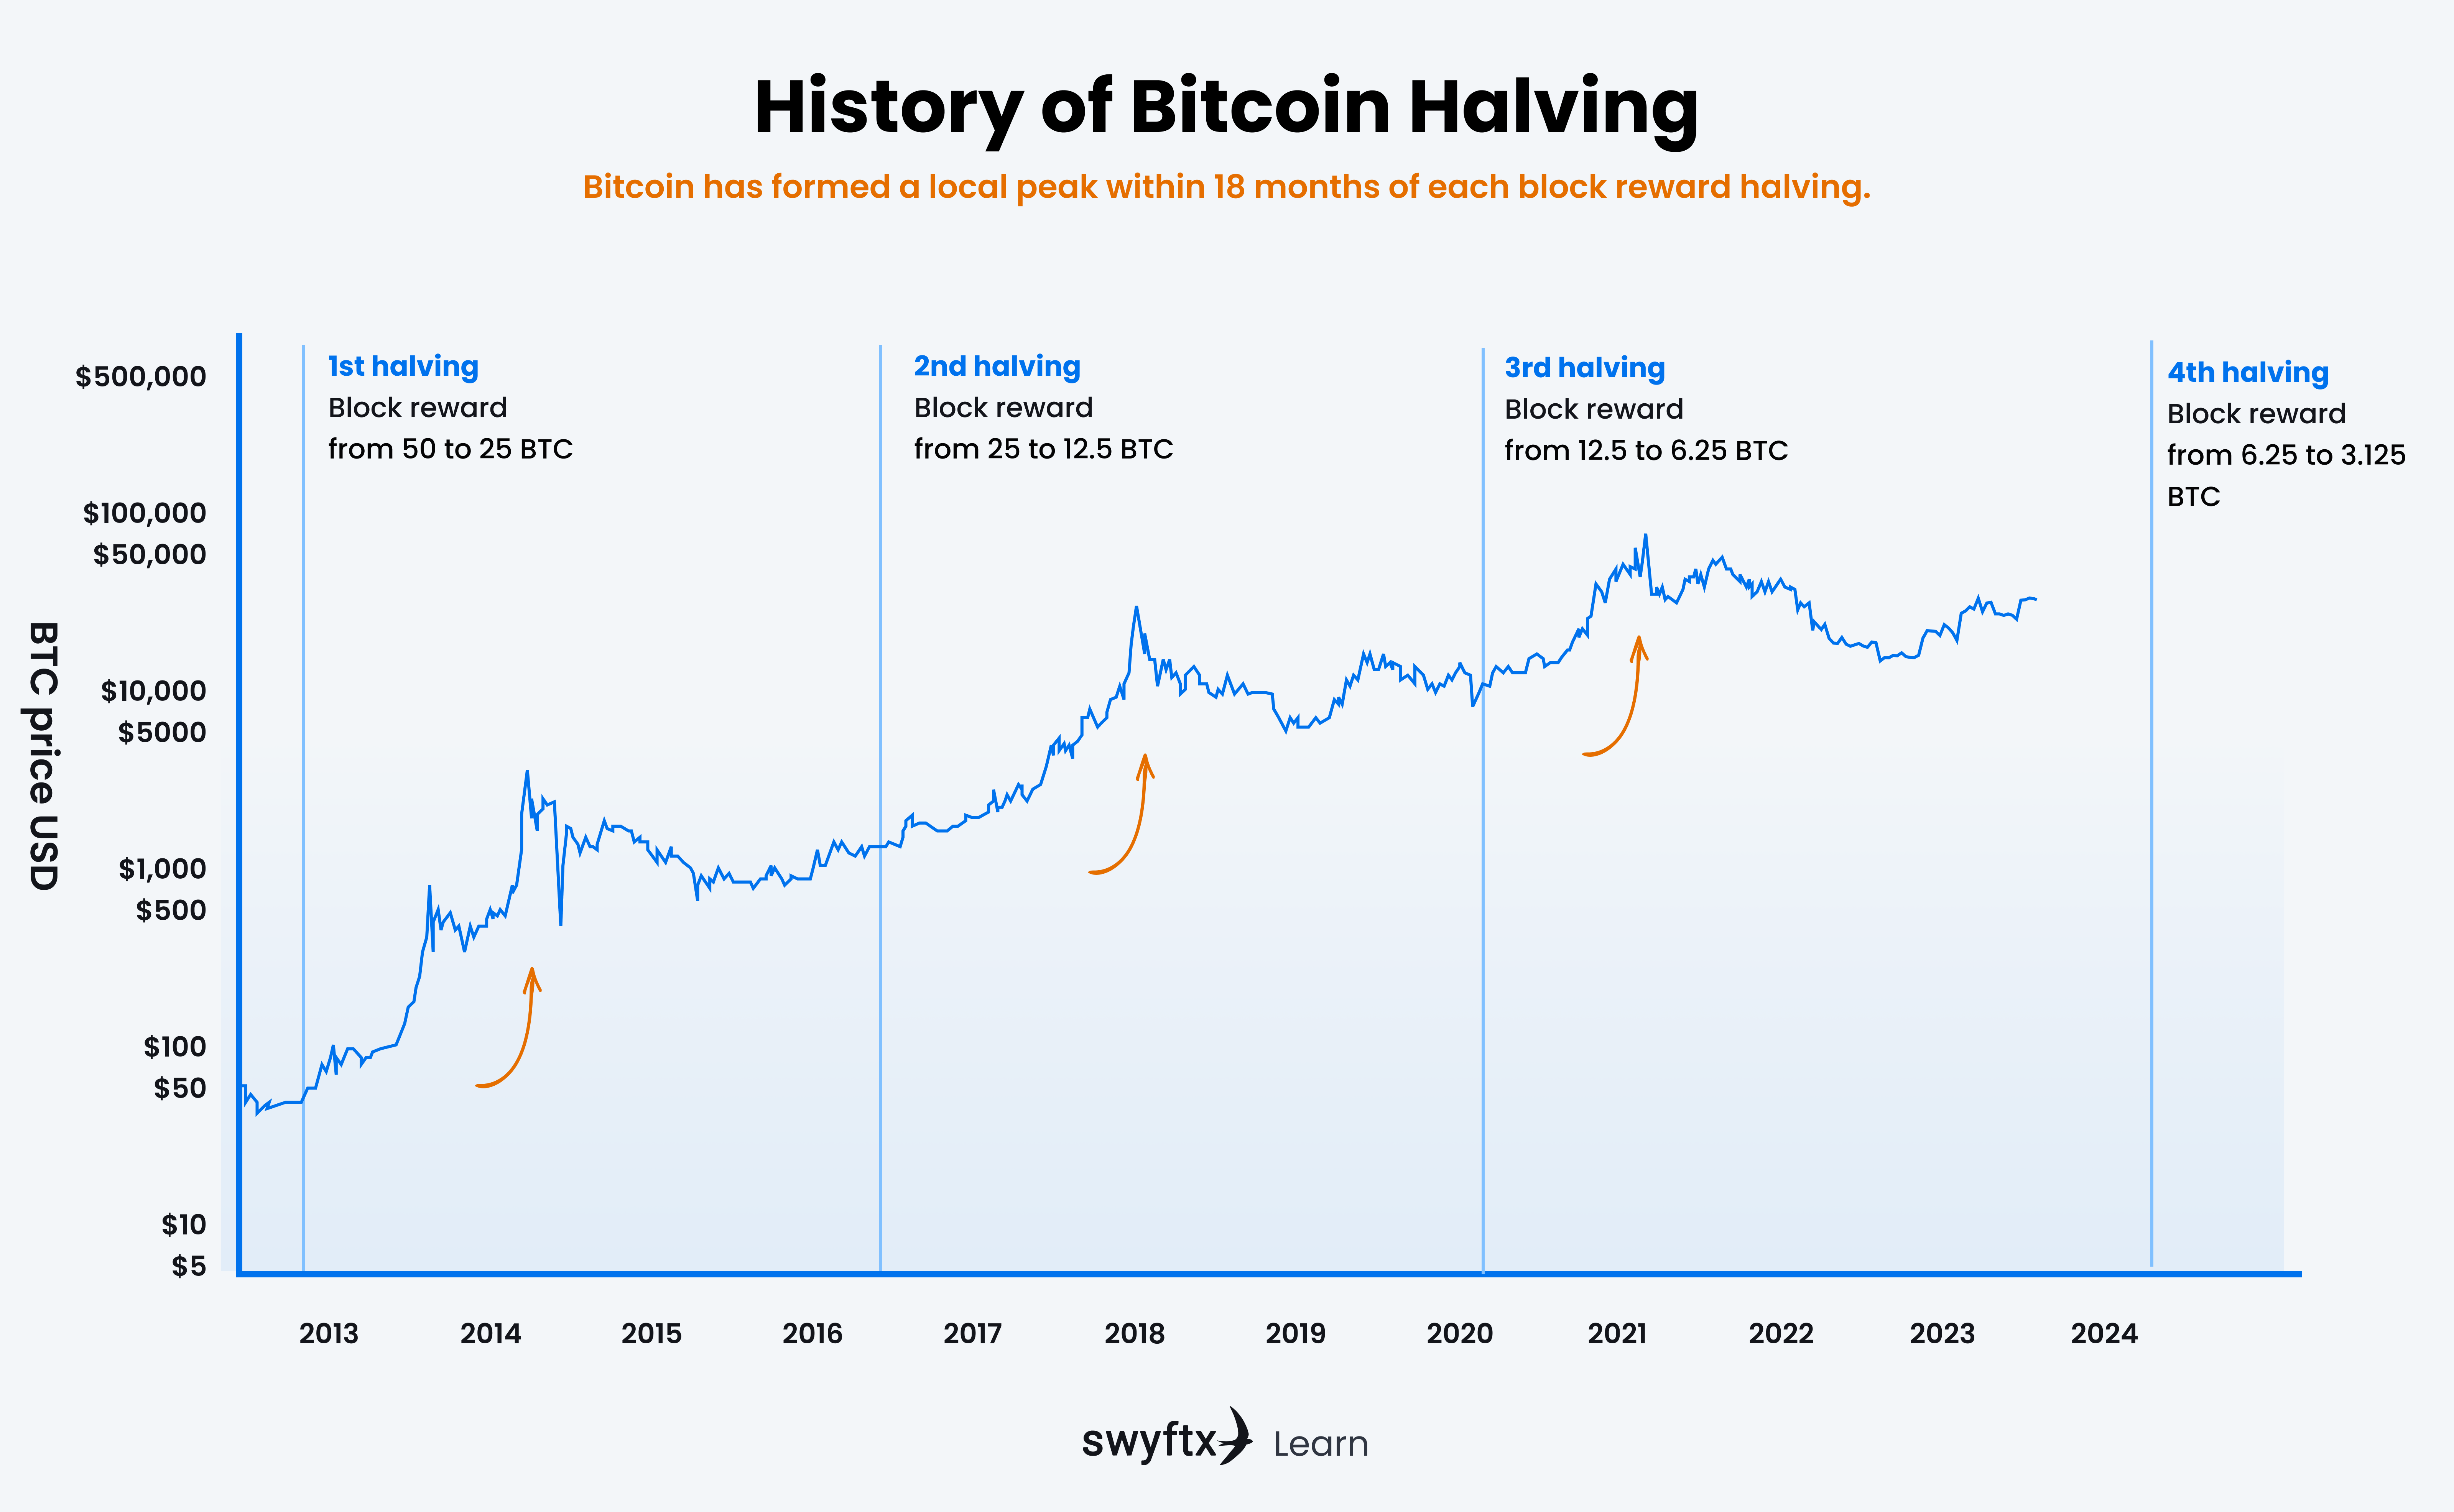
Figure 3 – Bitcoin price action following reward halvings
The next Bitcoin halving is slated for early-mid 2024, which will see the block reward reduced to 3.125 BTC. The crypto market’s run into the major event appears to exhibit some similarities to that of previous cycles – after a crash (2021), the coin’s price slowly builds (like in 2023, with BTC up nearly 100%). However, it is important to remember that there are more factors than just the halving that can impact Bitcoin (and the broader crypto market) price. These include regulation and macroeconomic factors, such as the conflicts in Eastern Europe and the Middle East, as well as substantial inflation, resulting in the cost of living crisis.
Historical impact of the Bitcoin Halving
2012 Halving: Marking Bitcoin’s first ever halving, this event occurred roughly four years following the cryptocurrency’s inception. BTC’s price went from approximately $133 before the halving to $845, marking a ~535% increase.
2016 Halving: By this point, Bitcoin had garnered increased public awareness, and media outlets provided more extensive coverage. Similar to the 2012 event, the price of Bitcoin began an upward trajectory, signalling a new stage in its market evolution. The price of BTC went from approximately $2,828 before the halvin nd peaked at $16,642, marking ~488% increase.
2020 Halving: The latest halving happened in 2020 and saw a considerable uptick in Bitcoin’s valuation, drawing even greater mainstream focus. This event occurred at the same time as the COVID pandemic hit, which resulted in a liquidity injection from Reserve Banks worldwide. BTC’s price went from approximately $8,610 before the halving to $68,789, marking ~698% increase.
The above price data was taken from Coinmarketcap, is in USD, and show the price just before the halving event to the high in the cycle that follows.
It’s important to note that Bitcoin is only 14 years old, meaning it’s still in its infancy. It is unlikely that the entire crypto market will follow this 4-year halving cycle forever, meaning a bull market starting in 2024 is not guaranteed, nor may any price increase see increases that occurred in previous halving events.
Summary
It’s vital that investors understand all crypto markets move in cycles. Because, as much as we wish it were – it’s impossible for markets only to move upwards.
Interpreting market cycles can provide investors with a useful macro perspective, helping them make more informed decisions before entering a trade. In addition, the cycles measure market activity over a longer period of time, ensuring inexperienced investors don’t get trapped in the emotion of short-term trading.
This piece has explained what a market cycle is, how to attempt to identify the stages, and what is a Bitcoin halving.
Quiz

Disclaimer: The information on Swyftx Learn is for general educational purposes only and should not be taken as investment advice, personal recommendation, or an offer of, or solicitation to, buy or sell any assets. It has been prepared without regard to any particular investment objectives or financial situation and does not purport to cover any legal or regulatory requirements. Customers are encouraged to do their own independent research and seek professional advice. Swyftx makes no representation and assumes no liability as to the accuracy or completeness of the content. Any references to past performance are not, and should not be taken as a reliable indicator of future results. Make sure you understand the risks involved in trading before committing any capital. Never risk more than you are prepared to lose. Consider our Terms of Use and Risk Disclosure Statement for more details.
 Article read